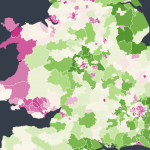
For methodology see bottom of page
Tax
"Tax rates for high earners should be minimised to keep the UK competitive"
Intro
The final in our UnHerd Britain series is the vexed question of tax.
In particular, how persuaded are voters of the business reasons for keeping taxes lower?
Why not look up your own constituency and see how it ranks, from 1 to 632...
most supportive
in the country
least supportive
in the country
Methodology note
Focaldata specialises in mapping opinion poll data onto smaller geographic areas, using a technique known as MRP, or Multilevel Regression with Post-stratification. For this study we collected data from 21,119 respondents between 15th January and 4th November 2019 using an online panel provider. While this does not yield enough observations in individual constituencies to treat the data as separate constituency polls, we can look for patterns in responses across constituencies that have similar characteristics, and then work out the implications of those patterns for each constituency.
This technique of “multilevel regression and post-stratification” or MRP is the same approach we used by Focaldata to predict Vote Intention in Westminster constituencies. Focaldata's MRP model uses age, gender, working status, VoteGE2017, VoteEuRef, Religion as individual-level predictors in the model. It uses population density, % born in the UK, % agriculture, % gross income median. We use a bayesian exploded logit model, which is fit using Hamiltonian Monte Carlo with the open source software Stan.
NOTE: These estimates include the 632 constituencies in England, Scotland and Wales, but not the 18 constituencies in Northern Ireland
 The Royals
  Gender
  Immigration
  Religion
  Free Speech
  Tax
Tax 

